Case study · A personal project — one family, one move
A map of the neighborhood, not the house
The problem
“I needed a reliable way to judge a neighborhood remotely, as if I were there.”
There is an abundance of public data available, free to access but usually difficult to sift through. Stitching four of those public datasets together helped narrow the gap between scrolling the endless listings on realty websites and getting the fuzzy human feeling of touring a house in a neighborhood that feels like a community.
Where it started
Photos of the house, and nothing about the neighborhood.
My wife and I were thinking of moving to central North Carolina, somewhere between the Triangle and the Triad. We started the usual way, trawling Zillow, Redfin and Realtor.com. We have a three-year-old, and a new set of concerns about where we land. We found plenty of houses we liked the pictures of. But we knew seeing a house in person is different from seeing it online, and we were over 200 miles away.
Every decision was being made through listing photos, with only a trip or two to go and look. And the photos are getting harder to trust. Wide-angle lenses have always made rooms look bigger; now listings are touched up and staged with AI, and I have seen furniture inserted into rooms where it would never physically fit. AI can help you picture what a space could be. It can also mislead you about what it is. When that is your only way to look at houses, the search gets slow and frustrating.
Listing sites do mention schools and walkability, but each one is collapsed into a single score. You never see how close the house actually is to the school, or to a store, or where a trail goes. And listings aren't allowed to tell you who lives nearby. The data that answers those questions is public, but it lives with four different agencies and none of it is shaped around a house hunt.
How it grew
One question at a time
Every layer on the map started as something we wanted to know and couldn't find out from the listing. The questions came in the order our priorities did.
Start with the listings
The first version did one thing: import a house from any of the listing sites. It added a pin to the map, kept the original listing as a reference, and stored the house in a database so it persisted. We found plenty we liked the look of.
Schools gave us the first real filter
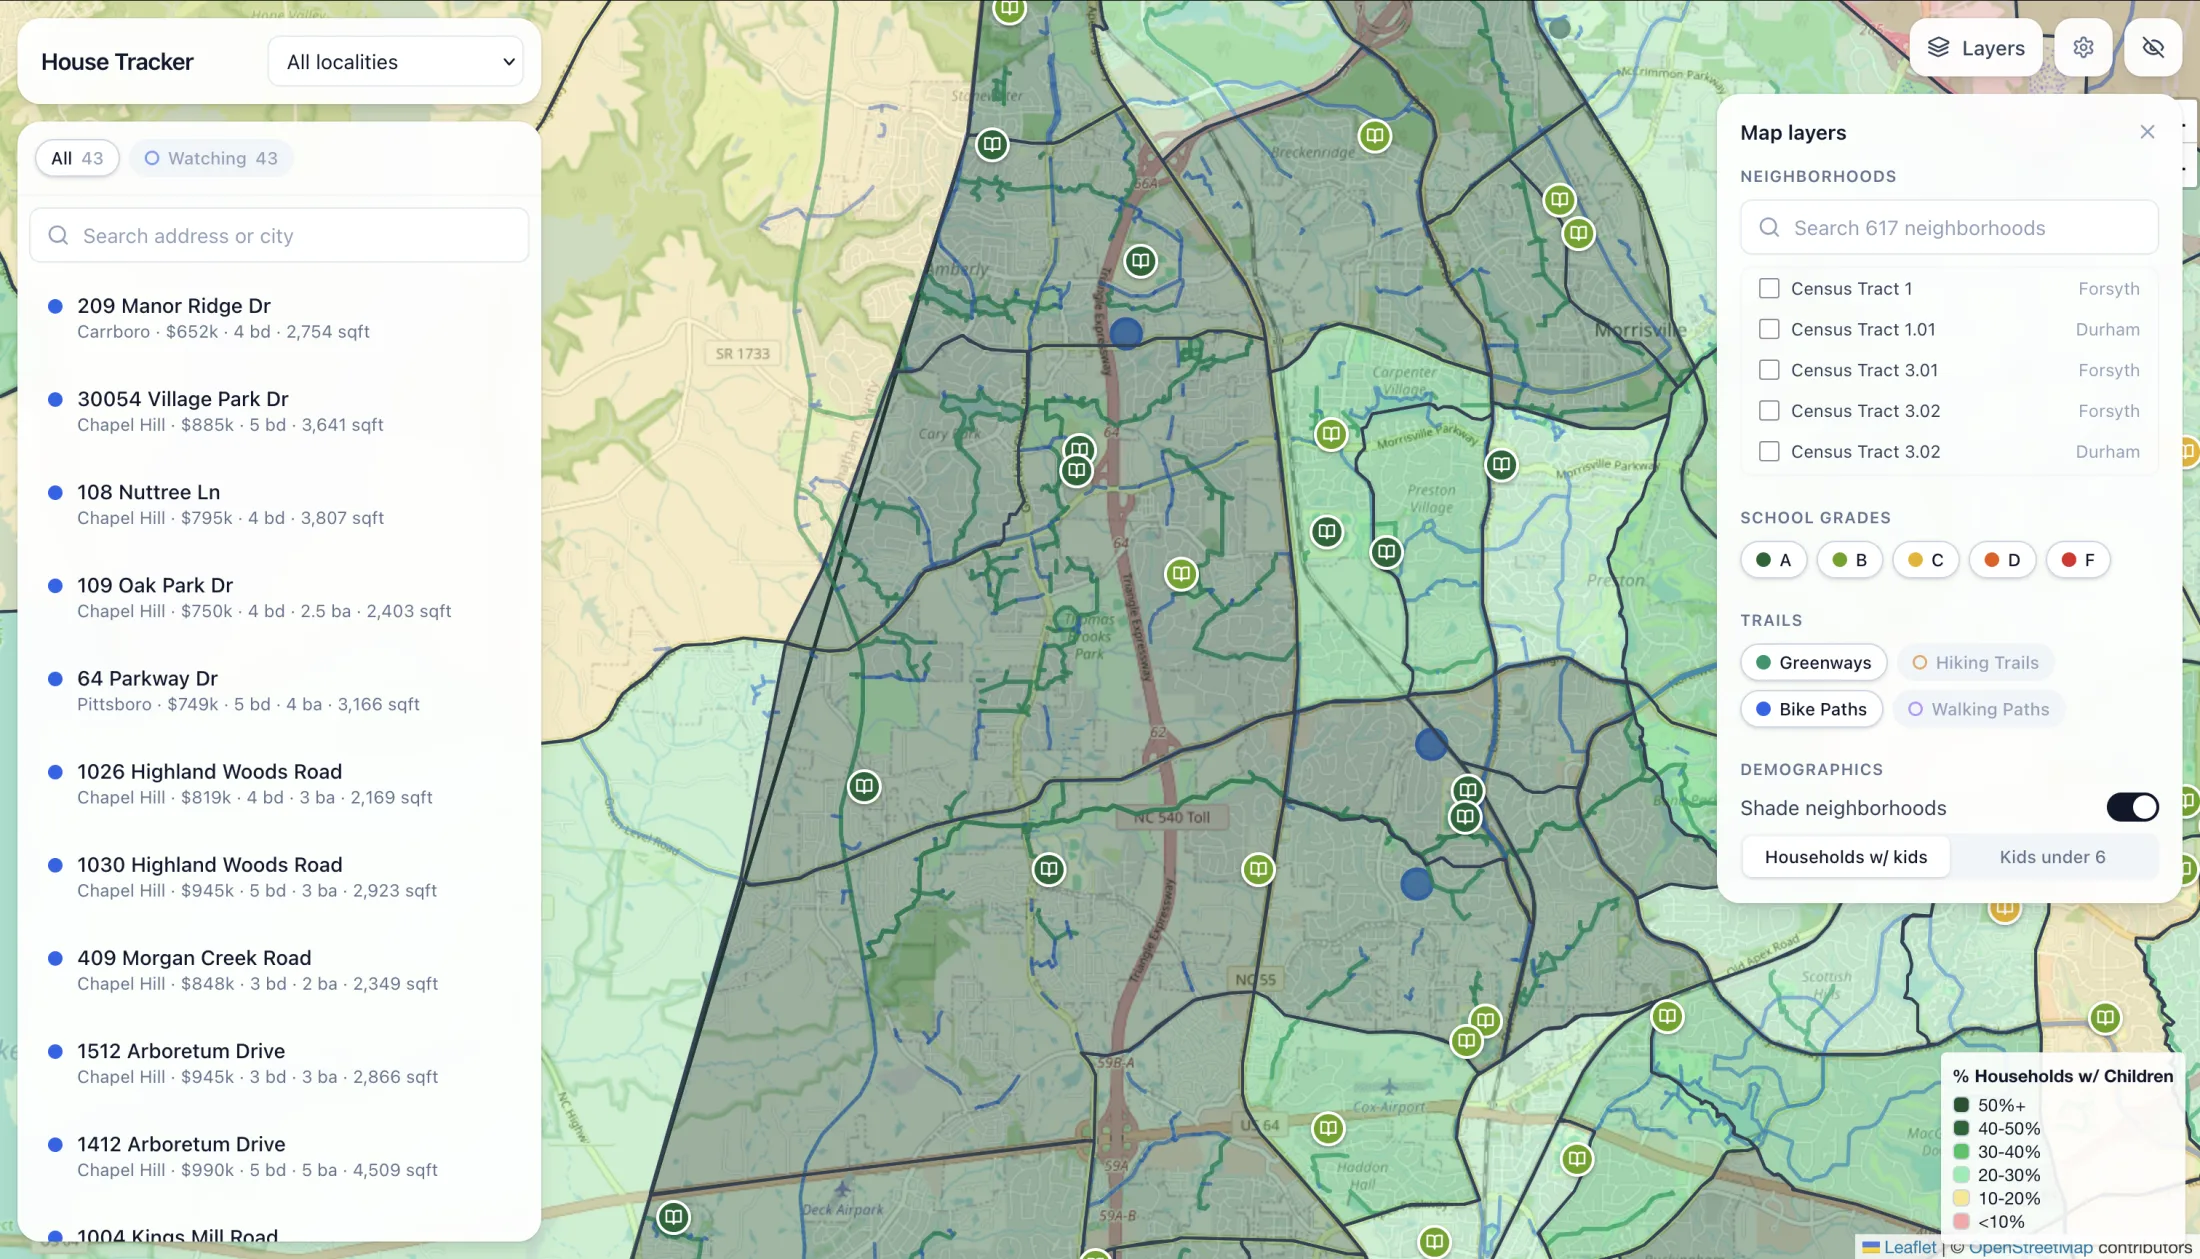
Good schools were the first thing we knew we needed, so the first layer of data was every public school. Locations came from federal records, performance grades from the state's published results, and each school was color-coded by its grade. The search narrowed to the areas around the schools we'd want.
In person
The first trip changed the question
A short trip to tour houses and get an in-person feel for the neighborhoods. One thing stood out: the sense of community. It might seem small, but a walking trail from the neighborhood to the school felt like a big improvement over neighborhoods that didn't have one. Parents see each other every day on the way to and from school. Kids see each other on the trails, and have the parks and playgrounds within reach of the house.
So the trails went on the map
Greenways, hiking trails, bike paths and walking paths, from public records, laid over the top. With everything on at once it was overwhelming at first, but it made it easy to spot the paths that ran to the schools and into the surrounding neighborhoods. The neighborhoods we had seen in person and liked started to match the ones the data picked out.
Then the kids
The last thing we wanted was other young families. We love the idea of kids roaming the neighborhood safely and ringing a friend's doorbell to see if they can play, and that needs other kids nearby. So the latest census data went in: each county split into census tracts and shaded by households with children, and children under six. Now we could zero in on areas with plenty of kids around our child's age, good schools and lots of trails.
In person
The second trip confirmed it
A second trip was already planned. We detoured into a specific neighborhood we had found through the map, and it was what we'd hoped for. That was when we trusted the data.
And the limits
What the map can't tell you
With every layer on, the map is hard to read — shaded tracts, pins, school icons and tens of thousands of trail lines all at once. It becomes useful when you layer in only what you care about, so trails now load off and each type is its own toggle, and schools filter by grade. The data has limits too. Private and Montessori schools aren't in the public records, and charter schools appear without a grade because their test scores aren't published, so each of those got looked up by hand once we knew the areas we wanted. And census estimates are collected over years and published late, so that layer shows where a neighborhood has been heading, not exactly what it is today.
Nothing on the map is guessed or scraped from a listing site. Every point traces to a named public source: school locations from NCES, grades from NC DPI's School Performance Grades, trails from OpenStreetMap, and household data from the Census Bureau's American Community Survey. And it was tested the only way that counts. From over 200 miles away the map pointed to a neighborhood, and in person it held up.
Built with
Listings are imported on demand, one pasted link at a time. Each data layer is fetched by a script run by hand when the data needs refreshing. The layers arrived as the questions did: listings and schools in late February, trails in mid-March, census tracts at the end of March.
The first trip told me what to measure. The second one told me I could trust it.
The app
All of it, in one place
What can't your tools tell you?
This one was a house hunt, but the premise holds. There is no substitute for the gut feelings people have. But being able to name and identify those feelings lets us bridge the gap between qualitative and quantitative measurements.